Bestand:Energy change inventory, 1971-2010.svg

Oorspronkelijk bestand (SVG-bestand, nominaal 525 × 365 pixels, bestandsgrootte: 2 kB)
| Dit is een bestand van Wikimedia Commons. Onderstaande beschrijving komt van de beschrijving van het bestand daar. |
Beschrijving
| Beschrijving |
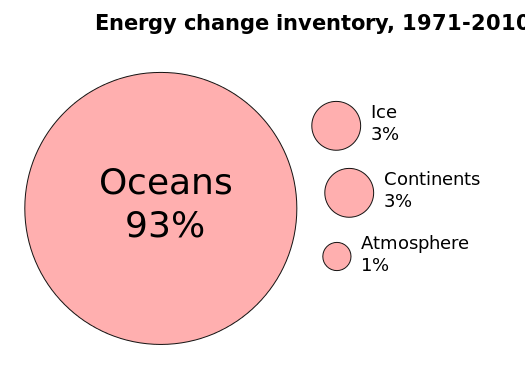
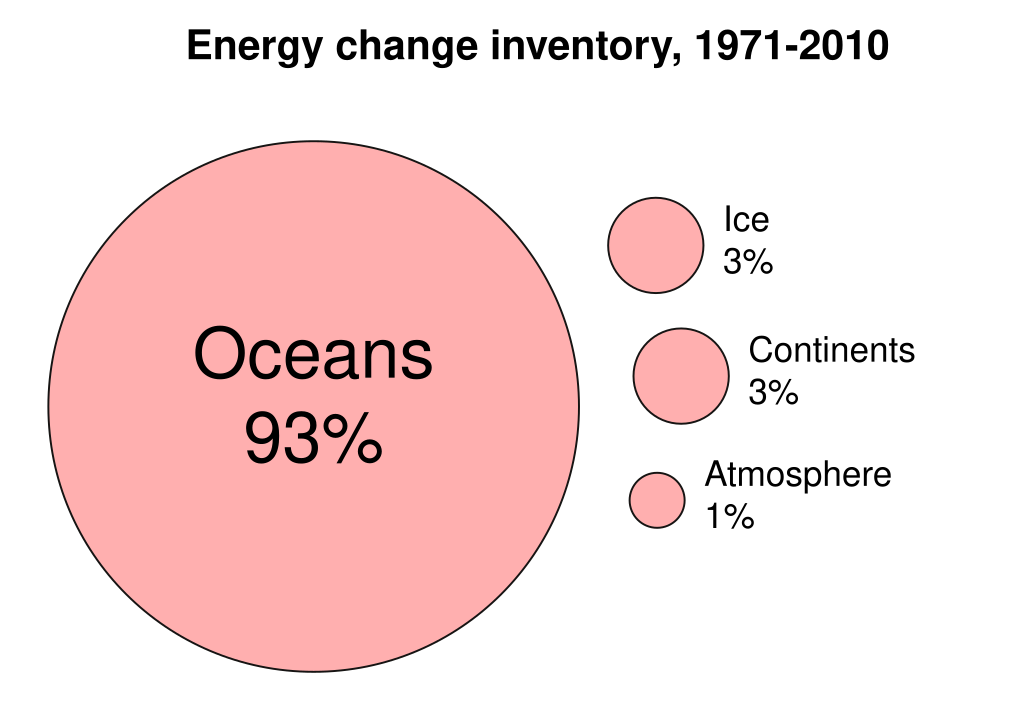
English: This bubble graph shows how the extra energy trapped by anthropogenic (i.e., human) greenhouse gases has been distributed on the Earth. This is referred to as "radiative imbalance", where less energy leaves Earth's atmosphere than enters it. Earth has been in radiative imbalance since at least the 1970s. Most of this extra energy has been absorbed by the oceans.
Data The following data shows how the extra energy trapped mainly by anthropogenic greenhouse gases has been distributed on the Earth between 1971 and 2010:
The biggest uncertainty is found in the energy invertory of the deep ocean (more than 700 m) due to a scarcity of data points. The deep ocean accounts for 29% procent of the total extra energy trapped. Further information can be found in the source listed in the references section. References
|
| Datum | |
| Bron | Eigen werk |
| Auteur | Enescot |
| Andere versies |
 |
Comma-separated values
In this graph, the area of the circles is proportional to the sink's absorption of energy. The radius of the circles equals the square root of (area / π).
Data were exported from OpenOffice.org 4.0.0 Calc as comma separated values (csv). The following options were used:
- Character set: Western Europe 1252
- Field delimiter: ,
- Text delimiter: "
- Quote all text cells: no
- Save cell content as shown: yes
- Fixed column width: no
Sink,a=area,r=radius,d=diameter
Oceans,93,5.4408473067,10.8816946134
Ice,3,0.9772050238,1.9544100476
Continents,3,0.9772050238,1.9544100476
Atmosphere,1,0.5641895835,1.1283791671
Licentie
| Dit bestand is beschikbaar onder Creative Commons CC0 1.0 Universele Public Domain Dedication. | |
| De persoon die een werk voorziet van deze licentie stelt dit werk beschikbaar aan het publieke domein door, voor zover dit wettelijk is toegestaan, afstand te doen van alle rechten op het werk in de zin van het auteursrecht, met inbegrip van alle aanverwante of naburige rechten. U kunt het werk kopiëren, aanpassen, distribueren en uitvoeren, ook voor commerciële doeleinden, zonder dat u daarvoor toestemming hoeft te vragen.
|
Bestandsgeschiedenis
Klik op een datum/tijd om het bestand te zien zoals het destijds was.
| Datum/tijd | Miniatuur | Afmetingen | Gebruiker | Opmerking | |
|---|---|---|---|---|---|
| huidige versie | 15 apr 2015 09:55 | | 525 × 365 (2 kB) | Mikima | fixed font rendering |
| 7 nov 2013 09:04 |  | 656 × 456 (31 kB) | Enescot | User created page with UploadWizard |
Bestandsgebruik
Dit bestand wordt op de volgende pagina gebruikt:
Globaal bestandsgebruik
De volgende andere wiki's gebruiken dit bestand: