Bestand:Sahel rainfall timeseries en.svg

Afmetingen van deze voorvertoning van het type PNG van dit SVG-bestand: 630 × 270 pixels Andere resoluties: 320 × 137 pixels | 640 × 274 pixels | 1.024 × 439 pixels | 1.280 × 549 pixels | 2.560 × 1.097 pixels.
Oorspronkelijk bestand (SVG-bestand, nominaal 630 × 270 pixels, bestandsgrootte: 25 kB)
| Dit is een bestand van Wikimedia Commons. Onderstaande beschrijving komt van de beschrijving van het bestand daar. |
W3C-validity not checked.
Beschrijving
| Beschrijving |
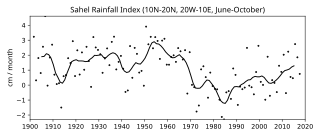
English: More than a century of rainfall data in the Sahel show an unusually wet period from 1950 until 1970 (positive index values), followed by extremely dry years from 1970 to 1990 (negative index values). From 1990 until present rainfall returned to levels slightly below the 1898–1993 average, but year-to-year variability was high. |
| Datum | |
| Bron | Own work, based on JISAO data |
| Auteur | Benedikt.Seidl |
| Toestemming (Hergebruik van dit bestand) |
Image:Sahel rainfall timeseries.gif, Image:Sahel rainfall timeseries de.svg |
Licentie
| Ik, de auteursrechthebbende van dit werk, geef dit werk vrij in het publieke domein. Dit is wereldwijd van toepassing. In sommige landen is dit wettelijk niet mogelijk; in die gevallen geldt: Ik sta iedereen toe dit werk voor eender welk doel te gebruiken, zonder enige voorwaarden, tenzij zulke voorwaarden door de wet worden voorgeschreven. |
Bestandsgeschiedenis
Klik op een datum/tijd om het bestand te zien zoals het destijds was.
| Datum/tijd | Miniatuur | Afmetingen | Gebruiker | Opmerking | |
|---|---|---|---|---|---|
| huidige versie | 24 dec 2019 01:19 | | 630 × 270 (25 kB) | Rainald62 | updated, moved title to top, added observational region as defined by the index, added units, changed bar graph to scatter plot (de-emphasizing the arbitrary zero level), added smoothed data as line (7-point cosine kernel). |
| 1 jul 2008 21:06 |  | 706 × 322 (48 kB) | Bender235 | {{Information |Description={{en|1=More than a century of rainfall data in the Sahel show an unusually wet period from 1950 until 1970 (positive index values), followed by extremely dry years from 1970 to 1990 (negative index values). From 1990 until prese |
Bestandsgebruik
Dit bestand wordt op de volgende pagina gebruikt:
Globaal bestandsgebruik
De volgende andere wiki's gebruiken dit bestand:
- Gebruikt op ar.wikipedia.org
- Gebruikt op de.wikipedia.org
- Gebruikt op en.wikipedia.org
- Gebruikt op hu.wikipedia.org
- Gebruikt op www.wikidata.org