Bestand:Projected changes in crop yields at different latitudes with global warming.png
Oorspronkelijk bestand (1.322 × 694 pixels, bestandsgrootte: 16 kB, MIME-type: image/png)
| Dit is een bestand van Wikimedia Commons. Onderstaande beschrijving komt van de beschrijving van het bestand daar. |
Beschrijving
| Beschrijving |
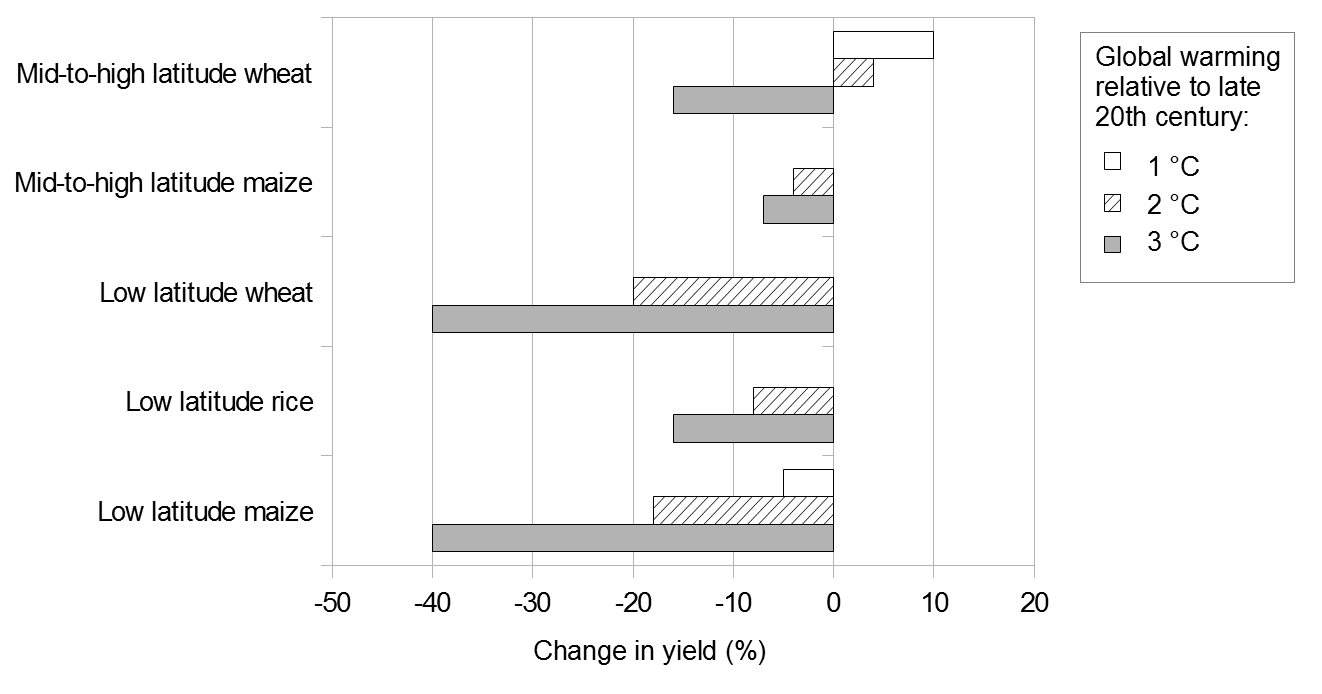
English: This bar graph shows projected changes in crop yields at different latitudes with global warming. Projected changes are shown for 1-3 °C of global warming, relative to late 20th century. For mid-to-high latitudes, changes in yield are shown for wheat and maize. For low-latitudes, changes are shown for wheat, rice and maize. In mid-to-high latitudes:
In low latitudes:
Data Values are approximate and are taken from the US National Research Council (US NRC, 2011).[1] The first, second and third numbers are the projected changes in yields (%) for 1, 2 and 3 °C of global warming, respectively.:
US NRC (2011)[1] drew on several studies. The graph does not show the "likely" ranges included in US NRC (2011).[1] The likely range means that there is a 67% chance of the projected change in yield being correct, based on expert judgement.[1] For 1 °C of global warming, the likely range is roughly equal to plus or minus (+/-) 10% for all projected changes in yields. Uncertainty increases with temperature. For 3 °C of warming, the likely range is roughly:
These projections broadly show the probable changes in regional yields.[2] The projections do not include measures to adapt to global warming.[2] Actual changes in yields may vary according to local conditions.[2] There are numerous other uncertainties, including how local climate will change with global warming, and the atmospheric concentration of carbon dioxide (CO2) associated with different magnitudes of global warming.[2] There is also the possibility that yields will change if critical thresholds are crossed.[2] Many of the uncertainties could bias the projections towards underestimating reductions in crop yields.[2] However, adaptation practices could help to reduce losses in yields.[2] Adaptation will be more difficult for higher magnitudes of warming, and may be less effective in tropical regions.[2] Notes
References
|
| Datum | |
| Bron | Eigen werk |
| Auteur | Enescot |

|
Deze grafiek zou opnieuw moeten worden aangemaakt als een SVG-bestand door vectorafbeeldingen te gebruiken. Dit heeft een aantal voordelen; zie Commons:Media for cleanup voor meer informatie. Als er een SVG-formaat van deze afbeelding bestaat, dan deze graag uploaden. Nadat u dit heeft gedaan, gelieve dit sjabloon te vervangen door het sjabloon {{vector version available|nieuwe bestandsnaam.svg}} op deze afbeeldingspagina.
|
Comma-separated values
Data were exported from OpenOffice.org 3.4.1 Calc as comma-separated values (csv). The following options were used:
- Character set: Western Europe 1252
- Field delimiter: ,
- Text delimiter: "
- Quote all text cells: no
- Save cell content as shown: yes
- Fixed column width: no
,,,,,,
,,,,,,
,,,Global warming relative to late 20th century,,,
,,Region and crop,1,2,3,
,,Mid-to-high latitude wheat,10,4,-16,Changes in yield (%)
,,Mid-to-high latitude maize,0,-4,-7,
,,Low latitude wheat,0,-20,-40,
,,Low latitude rice,0,-8,-16,
,,Low latitude maize,-5,-18,-40,
Licentie
| Dit bestand is beschikbaar onder Creative Commons CC0 1.0 Universele Public Domain Dedication. | |
| De persoon die een werk voorziet van deze licentie stelt dit werk beschikbaar aan het publieke domein door, voor zover dit wettelijk is toegestaan, afstand te doen van alle rechten op het werk in de zin van het auteursrecht, met inbegrip van alle aanverwante of naburige rechten. U kunt het werk kopiëren, aanpassen, distribueren en uitvoeren, ook voor commerciële doeleinden, zonder dat u daarvoor toestemming hoeft te vragen.
|
Bestandsgeschiedenis
Klik op een datum/tijd om het bestand te zien zoals het destijds was.
| Datum/tijd | Miniatuur | Afmetingen | Gebruiker | Opmerking | |
|---|---|---|---|---|---|
| huidige versie | 21 jul 2013 15:25 | | 1.322 × 694 (16 kB) | Enescot | {{Information |Description ={{en|1=This bar graph shows projected changes in crop yields at different latitudes with global warming. Projected changes are shown for 1-3&n... |
Bestandsgebruik
Dit bestand wordt op de volgende 2 pagina's gebruikt:
Globaal bestandsgebruik
De volgende andere wiki's gebruiken dit bestand:
- Gebruikt op ar.wikipedia.org
- Gebruikt op bn.wikipedia.org
- Gebruikt op en.wikipedia.org
- Gebruikt op mk.wikipedia.org
- Gebruikt op zh.wikipedia.org