Bestand:Lens and wavefronts.gif

Lens_and_wavefronts.gif(183 × 356 pixels, bestandsgrootte: 35 kB, MIME-type: image/gif, herhalend, 9 frames, 0,7 s)


slnglelens

Beschrijving

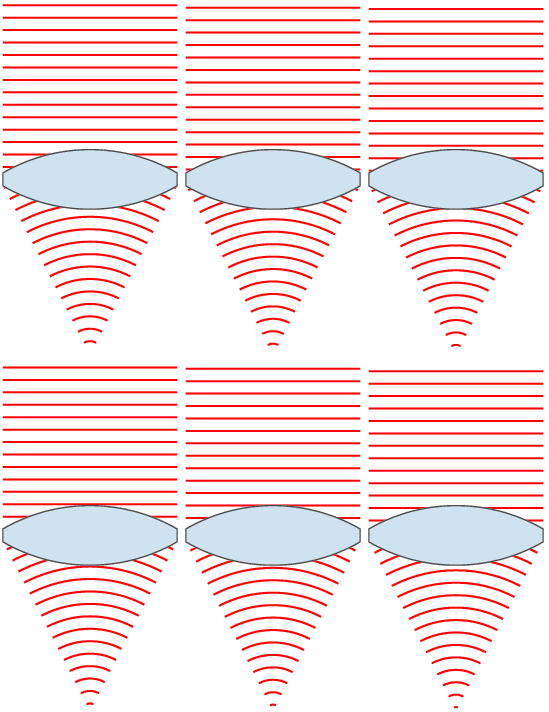
Beschrijving Illustration of wavefronts after passing through a lens. Interestingly, to produce a point source reverse the direction of the waves, with the focus point acting as a point source.
Datum (UTC)
Bron self-made with MATLAB
Auteur Oleg Alexandrov
Andere versies
 
Dit diagram is gemaakt met MATLAB.

Licentie

Public domain Ik, de auteursrechthebbende van dit werk, geef dit werk vrij in het publieke domein. Dit is wereldwijd van toepassing.
In sommige landen is dit wettelijk niet mogelijk; in die gevallen geldt:
Ik sta iedereen toe dit werk voor eender welk doel te gebruiken, zonder enige voorwaarden, tenzij zulke voorwaarden door de wet worden voorgeschreven.

siingleline

% Illustration of planar wavefronts going through a lens and getting focused
% into a converging spherical wave

function main ()

  % lens index
   n=1.5; 

  % number of points, used for plotting
   N = 100;

  % radii of lens surfaces
   R1 = 0.5; 
   R2 = 1.5;

  % centers of circles (y coord is 0)
   O1 = -2.9;
   O2 = -O1;

  % focal length
   f = (n-1)*(1/R1+1/R2); f = 1/f;
   
   % theta0 determines the width of the lens
   theta0=pi/6;
   Theta = linspace(-theta0, theta0, N);

  % right face of the lens
   L1x = R1*cos(Theta)+O1;
   L1y =R1*sin(Theta); 

   % left size of the lens
   L2x=-R2*cos(Theta)+O2;
   L2y = R2*sin(Theta);

   % flat top part
   Topx = [L1x(N), L2x(N)];
   Topy = [L1y(N), L2y(N)];

   % flat bottom part
   Botx = [L1x(1) L2x(1)];
   Boty = [L1y(1), L2y(1)];

   % the lens
   Lensx = [L1x rv_vec(Topx), rv_vec(L2x), Botx];
   Lensy = [L1y rv_vec(Topy), rv_vec(L2y), Boty];

   % Parameters for graphing
   Lens_color  = [204, 226, 239]/256;
   Lens_border = 0.3*[1, 1, 1];
   lbw = 1.3; % lens border width
   wavefr_color = [1, 0, 0];
   wavefr_bdw   = 2;
   
   % spacing between wavefronts (both plane and spherical ones)
   spacing = 0.25;

   % 2*H is the height of the plane wavefronts
   H = L1y(N); 

   % theta2 = slope of the line going from the upper-right
   % end of the lens to the focus point
   theta2 = atan(L1y(N)/(f-L1x(N)));

   % Shape of the spherical wavefronts.
   Theta = linspace(-theta2, theta2, N);
   X = -cos(Theta);
   Y =  sin(Theta);

   S = -f; % start ploting waves from here to the right

   % number of frames in the movie
   num_frames = 10;
   Shifts = linspace(0, spacing, num_frames+1);

   % start at S+shift, plot the wavefronts
   for frame_no = 1:num_frames

      shift = Shifts(frame_no);
      
      s = S+shift;

      % plotting window
      figure(1); clf; hold on; axis equal; axis off;

      % plot the plane wavefronts
      while s < 0
         plot([s, s], [-H, H], 'color', wavefr_color, 'linewidth', wavefr_bdw);
         s = s + spacing;
      end
      
   
      % plot the spherical wavefronts
      s = s - 10*spacing; % backtrack a bit
      while s < f
         
         rho = f-s;
         
         if rho*Y(N) <= L1y(N)
            plot(rho*X+f, rho*Y, 'color', wavefr_color, 'linewidth', wavefr_bdw);
         end
         
         s = s + spacing;
         
      end

      % plot the lens
      fill(Lensx, Lensy, Lens_color, 'EdgeColor', Lens_border, 'LineWidth', lbw);
%      get(H)
%      return
      
      % Invisible points to force MATLAB to keep the
      % plotting window fixed.
      tiny = 0.15*spacing;
      white = 0.999*[1, 1, 1];
      plot(S-tiny,   H+tiny, 'color', white);
      plot(S-tiny,  -H-tiny, 'color', white);
      plot(f+tiny,   H+tiny, 'color', white);
      plot(f+tiny,  -H-tiny, 'color', white);

      % Rotate by 90 degrees
      set(gca, 'View', [90, 90])

      % save current file
      frame_file = sprintf('Frame%d.eps', 1000+frame_no);
      disp(frame_file);
      saveas(gcf, frame_file, 'psc2');
      pause(0.07)
   end

% The frames were converted to a movie with the command
% convert -antialias -loop 10000  -delay 8 -compress LZW Frame100* Lens_and_wavefronts.gif
   
function W = rv_vec(V)

   K = length(V);

   W = V;
   for i=1:K
      W(i) = V(K-i+1);
   end

Bijschriften

Beschrijf in één regel wat dit bestand voorstelt
Siingleline

Items getoond in dit bestand

beeldt af

image/gif

Bestandsgeschiedenis

Klik op een datum/tijd om het bestand te zien zoals het destijds was.

Datum/tijdMiniatuurAfmetingenGebruikerOpmerking
huidige versie25 nov 2007 08:35Miniatuurafbeelding voor de versie van 25 nov 2007 08:35183 × 356 (35 kB)Oleg Alexandrovtweak
24 nov 2007 06:10Miniatuurafbeelding voor de versie van 24 nov 2007 06:10171 × 356 (33 kB)Oleg Alexandrovtweak
24 nov 2007 06:09Miniatuurafbeelding voor de versie van 24 nov 2007 06:09171 × 356 (33 kB)Oleg Alexandrovtweak
24 nov 2007 02:56Miniatuurafbeelding voor de versie van 24 nov 2007 02:56171 × 359 (33 kB)Oleg Alexandrovtweak, same license
24 nov 2007 02:53Miniatuurafbeelding voor de versie van 24 nov 2007 02:53171 × 359 (32 kB)Oleg Alexandrovtweak
24 nov 2007 02:49Miniatuurafbeelding voor de versie van 24 nov 2007 02:49151 × 359 (31 kB)Oleg Alexandrov{{Information |Description=Illustration of wavefronts after passing through a [:en:lens (optics)|lens]] |Source=self-made with MATLAB |Date=~~~~~ |Author= Oleg Alexandrov |Permission=see below |other_versions= }}

Dit bestand wordt op de volgende pagina gebruikt:

Globaal bestandsgebruik

De volgende andere wiki's gebruiken dit bestand:

Globaal gebruik van dit bestand bekijken.