Bestand:65 Myr Climate Change.png

65_Myr_Climate_Change.png(650 × 397 pixels, bestandsgrootte: 21 kB, MIME-type: image/png)


Beschrijving

Beschrijving
English:
Expanded view of climate change during the last five million years, showing the rapid oscillations in the glacial state.
View of climate change extending back through the last 540 million years, including many cycles of change from warm to cold and back again.

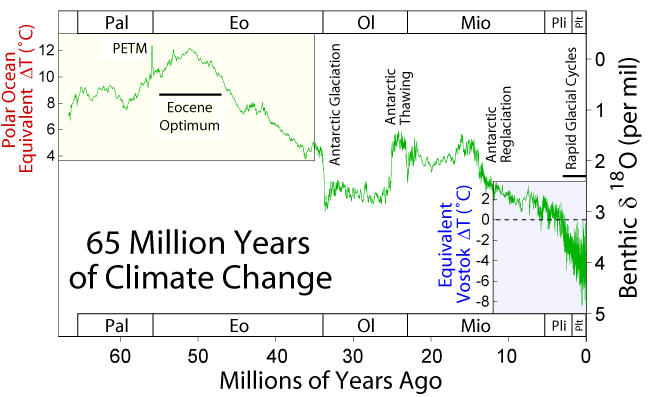
This figure shows climate change over the last 65 million years. The data are based on a compilation of oxygen isotope measurements (δ18O) on benthic foraminifera by Zachos et al. (2001) which reflect a combination of local temperature changes in their environment and changes in the isotopic composition of sea water associated with the growth and retreat of continental ice sheets.

Because it is related to both factors, it is not possible to uniquely tie these measurements to temperature without additional constraints. For the most recent data, an approximate relationship to temperature can be made by observing that the oxygen isotope measurements of Lisiecki and Raymo (2005) are tightly correlated to temperature changes at Vostok as established by Petit et al. (1999). Present day is indicated as 0. For the oldest part of the record, when temperatures were much warmer than today, it is possible to estimate temperature changes in the polar oceans (where these measurements were made) based on the observation that no significant ice sheets existed and hence all fluctuation in (δ18O) must result from local temperature changes (as reported by Zachos et al.).

The intermediate portion of the record is dominated by large fluctuations in the mass of the Antarctic ice sheet, which first nucleates approximately 34 million years ago, then partially dissipates around 25 million years ago, before re-expanding towards its present state 13 million years ago. These fluctuations make it impossible to constrain temperature changes without additional controls.

Significant growth of ice sheets did not begin in Greenland and North America until approximately 3 million years ago, following the formation of the Isthmus of Panama by continental drift. This ushered in an era of rapidly cycling glacials and interglacials (see figure at upper right).

Also appearing on this graph are the Eocene Climatic Optimum, an extended period of very warm temperatures, and the Paleocene-Eocene Thermal Maximum (labeled PETM). The PETM is very short lived high temperature excursion possibly associated with the destablization of methane clathrates and the rapid buildup of greenhouse gases in the atmosphere. Due to the coarse sampling and averaging involved in this record, it is likely that the full magnitude of the PETM is underestimated by a factor of 2-4 times its apparent height.
Datum 17 December 2005
Bron Eigen werk
Auteur Robert A. Rohde
Toestemming
(Hergebruik van dit bestand)
This figure was prepared by Robert A. Rohde from published and publicly available data and is incorporated into the Global Warming Art project.

Licentie

Image from Global Warming Art
This image is an original work created for Global Warming Art. Please refer to the image description page for more information.
GNU head Toestemming wordt verleend voor het kopiëren, verspreiden en/of wijzigen van dit document onder de voorwaarden van de GNU-licentie voor vrije documentatie, versie 1.2 of enige latere versie als gepubliceerd door de Free Software Foundation; zonder Invariant Sections, zonder Front-Cover Texts, en zonder Back-Cover Texts. Een kopie van de licentie is opgenomen in de sectie GNU-licentie voor vrije documentatie.
w:nl:Creative Commons
naamsvermelding Gelijk delen
Dit bestand is gelicenseerd onder de Creative Commons-licentie Naamsvermelding-Gelijk delen 3.0 Unported
De gebruiker mag:
  • Delen – het werk kopiëren, verspreiden en doorgeven
  • Remixen – afgeleide werken maken
Onder de volgende voorwaarden:
  • naamsvermelding – U moet op een gepaste manier aan naamsvermelding doen, een link naar de licentie geven, en aangeven of er wijzigingen in het werk zijn aangebracht. U mag dit op elke redelijke manier doen, maar niet zodanig dat de indruk wordt gewekt dat de licentiegever instemt met uw werk of uw gebruik van zijn werk.
  • Gelijk delen – Als u het werk heeft geremixt, veranderd, of erop heeft voortgebouwd, moet u het gewijzigde materiaal verspreiden onder dezelfde licentie als het oorspronkelijke werk, of een daarmee compatibele licentie.
Deze licentietag is toegevoegd aan dit bestand in verband met de GFDL licentie-update.


Notes

  • The data is plotted as a 10 point average of the original data to minimize measurement noise.
  • The absolute calibration of the early part of the record relative to modern-day is somewhat uncertain, so that the entire scale may need to be shifted ± a few degrees for a true comparison to present.
  • The labels on the top and bottom of the figure are abbreviations for different geologic epochs of the geologic time scale.
  • The data shown is very useful, when observing a long period of time.

References

  • Lisiecki, L. E., and M. E. Raymo (2005). "A Pliocene-Pleistocene stack of 57 globally distributed benthic δ18O records" (PDF). Paleoceanography 20: 1003. doi:10.1029/2004PA001071.[dead link]
  • Petit J.R., Jouzel J., Raynaud D., Barkov N.I., Barnola J.M., Basile I., Bender M., Chappellaz J., Davis J., Delaygue G., Delmotte M., Kotlyakov V.M., Legrand M., Lipenkov V., Lorius C., Pépin L., Ritz C., Saltzman E., Stievenard M. (1999). "Climate and Atmospheric History of the Past 420,000 years from the Vostok Ice Core, Antarctica". Nature 399: 429–436.
  • Zachos, James, Mark Pagani, Lisa Sloan, Ellen Thomas, and Katharina Billups (2001). "Trends, Rhythms, and Aberrations in Global Climate 65 Ma to Present". Science 292 (5517): 686–693. doi:10.1126/science.1059412.

derivative works

Afgeleide werken van dit bestand:

Bijschriften

Beschrijf in één regel wat dit bestand voorstelt

Items getoond in dit bestand

beeldt af

image/png

fde0e20cdda21a80377578d80f730e3bed593b68

21.498 byte

397 pixel

650 pixel

Bestandsgeschiedenis

Klik op een datum/tijd om het bestand te zien zoals het destijds was.

Datum/tijdMiniatuurAfmetingenGebruikerOpmerking
huidige versie18 jul 2010 15:15Miniatuurafbeelding voor de versie van 18 jul 2010 15:15650 × 397 (21 kB)SeL mediatime axis reversed
18 dec 2005 00:51Miniatuurafbeelding voor de versie van 18 dec 2005 00:51650 × 397 (25 kB)Saperaud~commonswiki*'''Description:''' [[en:Image:{{subst:PAGENAME}}]]

Globaal bestandsgebruik

De volgende andere wiki's gebruiken dit bestand:

Globaal gebruik van dit bestand bekijken.