Bestand:2013 Pacific typhoon season summary.png

Grootte van deze voorvertoning: 800 × 600 pixels. Andere resoluties: 320 × 240 pixels | 640 × 480 pixels | 1.024 × 768 pixels | 1.280 × 960 pixels | 2.560 × 1.920 pixels | 4.000 × 3.000 pixels.
Oorspronkelijk bestand (4.000 × 3.000 pixels, bestandsgrootte: 7,67 MB, MIME-type: image/png)
| Dit is een bestand van Wikimedia Commons. Onderstaande beschrijving komt van de beschrijving van het bestand daar. |
Beschrijving
| Beschrijving |
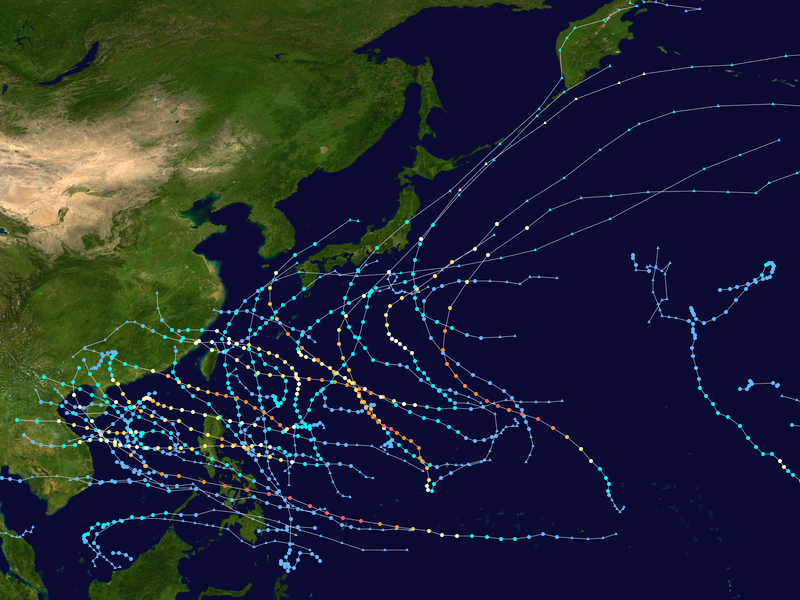
English: This map shows the tracks of all tropical cyclones in the 2013 Pacific typhoon season. The points show the location of each storm at 6-hour intervals. The colour represents the storm's maximum sustained wind speeds as classified in the Saffir-Simpson Hurricane Scale (see below), and the shape of the data points represent the type of the storm.
Tropical depression (≤38 mph, ≤62 km/h)
Tropical storm (39–73 mph, 63–118 km/h)
Category 1 (74–95 mph, 119–153 km/h)
Category 2 (96–110 mph, 154–177 km/h)
Category 3 (111–129 mph, 178–208 km/h)
Category 4 (130–156 mph, 209–251 km/h)
Category 5 (≥157 mph, ≥252 km/h)
Unknown
Storm type |
| Bron | Created using Wikipedia:WikiProject Tropical cyclones/Tracks. The background image is from NASA [1]. The tracking data is from the Joint Typhoon Warning Center's best track database |
| Auteur | Keith Edkins |
| Dit werk vrijgegeven in het publieke domein door de auteur, Keith Edkins. Dit is wereldwijd van toepassing. In sommige landen is dit wettelijk niet mogelijk; in die gevallen geldt: Keith Edkins staat iedereen toe dit werk voor eender welk doel te gebruiken, zonder enige voorwaarden, tenzij zulke voorwaarden door de wet worden voorgeschreven. |
Bestandsgeschiedenis
Klik op een datum/tijd om het bestand te zien zoals het destijds was.
| Datum/tijd | Miniatuur | Afmetingen | Gebruiker | Opmerking | |
|---|---|---|---|---|---|
| huidige versie | 5 apr 2020 23:13 | | 4.000 × 3.000 (7,67 MB) | Supportstorm | JTWC/JMA data, corrected point and line sizes |
| 28 aug 2018 06:22 |  | 3.295 × 2.471 (7,41 MB) | David Petrovsky | Added the dimensions and size both | |
| 8 sep 2014 01:46 |  | 3.000 × 2.471 (5,81 MB) | Supportstorm | Image created using merged tracks from IBTrACS. | |
| 13 jul 2014 11:05 |  | 3.000 × 1.854 (4,08 MB) | Keith Edkins | Using best track database. Specified "--dots 0.2" for better clarity. | |
| 5 jul 2014 06:06 |  | 3.000 × 1.854 (4,17 MB) | Cyclonebiskit | Reverted to version as of 08:06, 5 December 2013 | |
| 20 jun 2014 06:53 |  | 1.366 × 782 (855 kB) | Typhoon2013 | Added 2 depressions, Lehar, Phailin and crossover 30W (Wilma) | |
| 15 jun 2014 06:15 |  | 1.366 × 782 (756 kB) | Typhoon2013 | Created last version on this by my self on paint. Its a fail but its worth a try though. :) Keith Edkins, can you fix this if there is a problem? | |
| 5 dec 2013 10:06 |  | 3.000 × 1.854 (4,17 MB) | Keith Edkins | Add 33W | |
| 17 nov 2013 10:36 |  | 3.000 × 1.854 (4,16 MB) | Keith Edkins | Add Podul | |
| 12 nov 2013 10:48 |  | 3.000 × 1.854 (4,16 MB) | Keith Edkins | Add Haiyan and relevant part of 30W (Wilma) |
Bestandsgebruik
Dit bestand wordt op de volgende pagina gebruikt:
Globaal bestandsgebruik
De volgende andere wiki's gebruiken dit bestand:
- Gebruikt op de.wikipedia.org
- Gebruikt op en.wikipedia.org
- 2013 Pacific typhoon season
- Template:2013 Pacific typhoon season buttons
- Tropical Storm Rumbia (2013)
- Typhoon Soulik (2013)
- Typhoon Utor
- Tropical Storm Trami (2013)
- Typhoon Usagi (2013)
- Timeline of the 2013 Pacific typhoon season
- Typhoon Wutip (2013)
- Cyclone Phailin
- Typhoon Nari (2013)
- Typhoon Wipha (2013)
- Typhoon Krosa (2013)
- Typhoon Lekima (2013)
- Typhoon Haiyan
- Tropical Depression 18W (2013)
- Meteorological history of Typhoon Haiyan
- Tropical Storm Podul (2013)
- Cyclone Lehar
- Typhoon Fitow
- Tropical Storm Cimaron (2013)
- Typhoon Man-yi (2013)
- Typhoon Francisco (2013)
- Tropical Storm Jebi (2013)
- Tropical Storm Bebinca (2013)
- Tropical Storm Mangkhut (2013)
- Effects of the 2013 Pacific typhoon season in the Philippines
- Template:2013 Philippine typhoon season buttons
- User:Nino Marakot/2013 Pacific typhoon season
- User:Tfmbty/2013 Pacific typhoon season
- Tropical depressions Wilma and BOB 05
- Gebruikt op es.wikipedia.org
- Gebruikt op fr.wikipedia.org
- Gebruikt op ja.wikipedia.org
- Gebruikt op km.wikipedia.org
- Gebruikt op ko.wikipedia.org
- Gebruikt op pt.wikipedia.org
Globaal gebruik van dit bestand bekijken.